
In order to make a forecasting, we need to understand what’s we are predicting. Meteorologists analyze the weather situation before do the forecasting. Because there could be no two cases are the same, we classify similar characters weather situation into groups. Via classify the weather situation, we can predict the next possible status from the recent status. In this post, I would show some ways for weather analysis and classification.
- The Forecast Process: Observing and Analysis https://www.weather.gov/rah/virtualtourfcstobsanalysis
- Lorenz, E. N. (1963). Deterministic nonperiodic flow. Journal of atmospheric sciences, 20(2), 130-141.
Observation Analysis
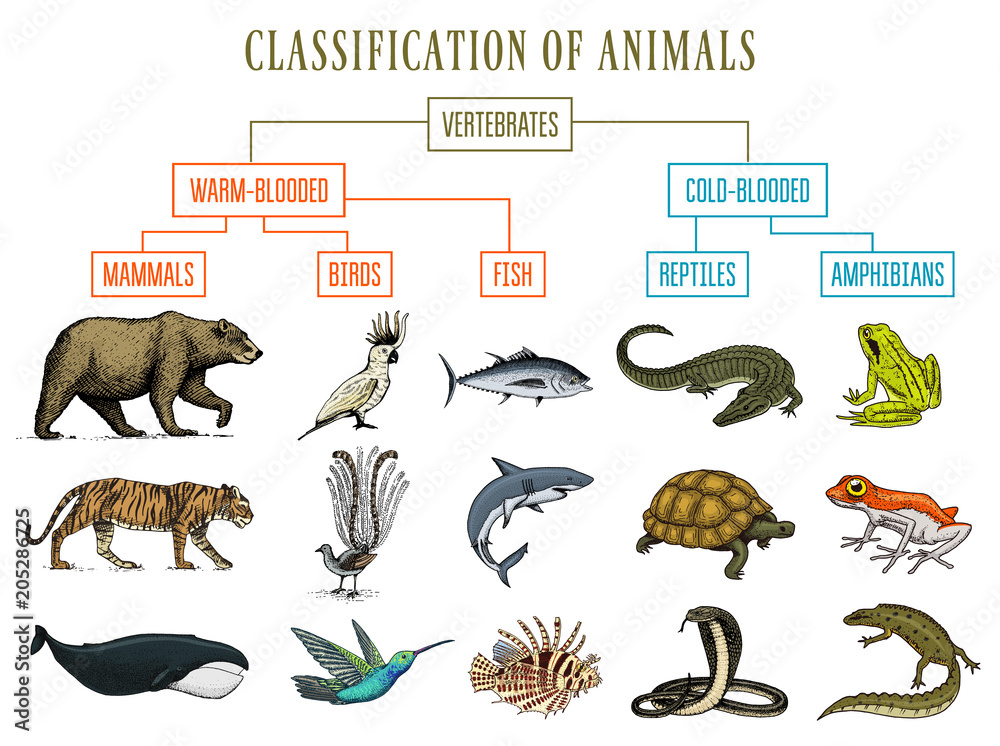
When we recognize an animal, we try to observe the shape of body, the sound of voice, the favorite foods and behavior movements. Just like to recognize an animal, we can classify a weather system by observations.
We can dissect a weather system in different ways. For static snapshot, we have draw status chart and vertical profiles. For movement observation, we can use time series and Hovmoller diagram. Here are the list of tools:
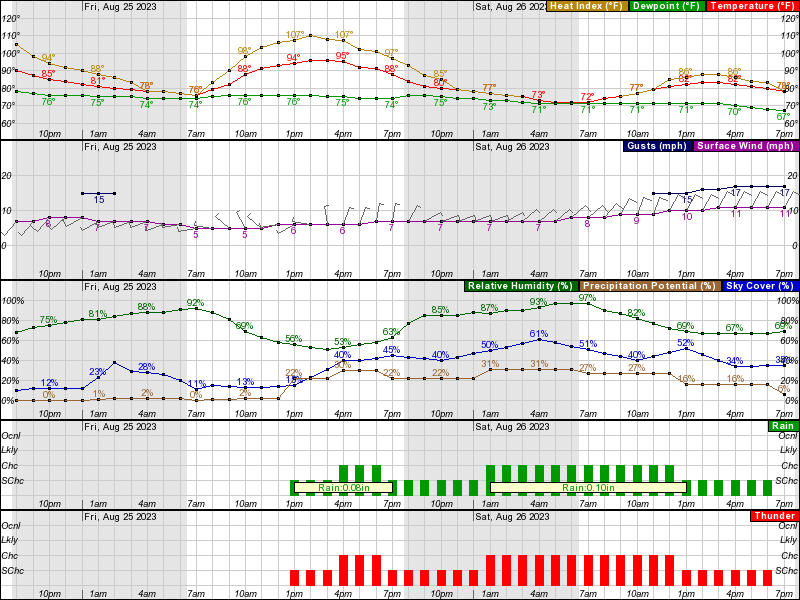
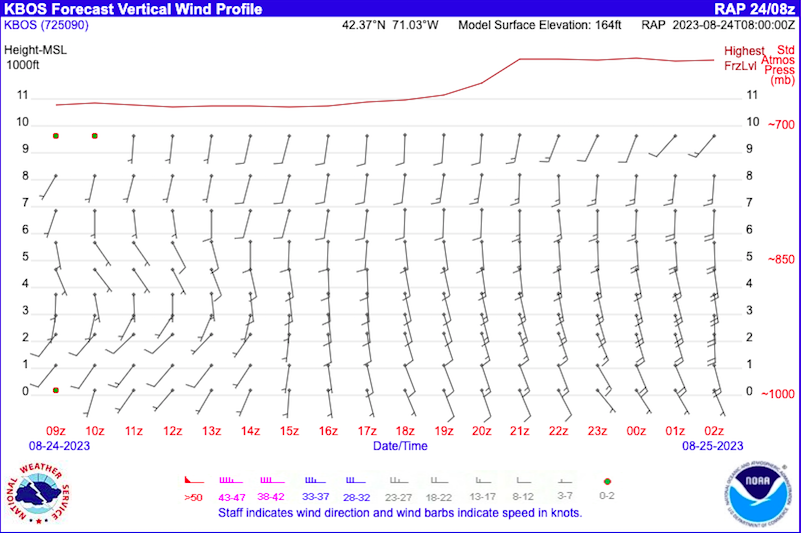
- 1D time series
- Time series plot is the record of single observation point through time.
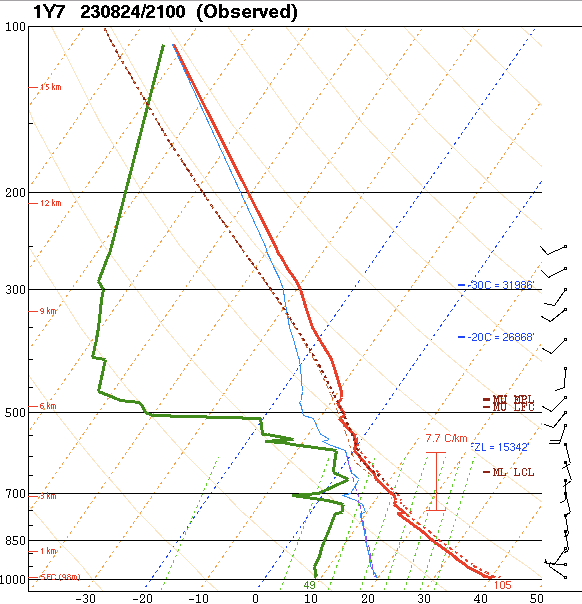
- 1D vertical profile – Screw-T diagram
- Screw-T diagram is a vertical observation profile to see the vertical atmospheric structure at a single observation point at certain moment.
- 2D status chart: Horizontal chart (x-y plot)
- Horizontal chart is a snapshot to show the weather pattern in a range of area at certain moment
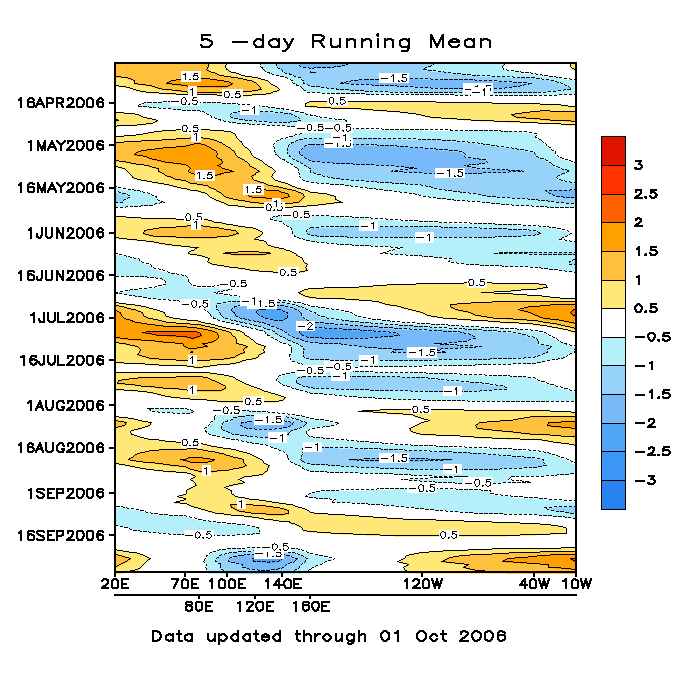
- 2D time series: Hovmoller diagram (x-t, y-t, z-t plots)
- Hovmoller diagram uses a cut of profile to see how the observation on this line changes through time
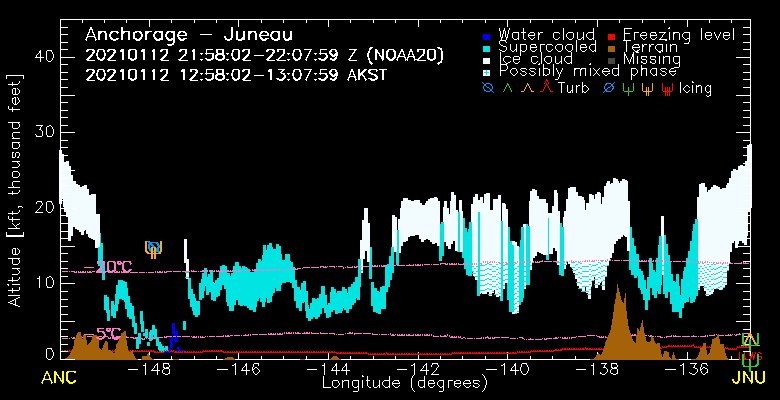
- 2D vertical profile: Cross section (x-z or y-z plots)
- Cross section shows the vertical profile of a certain line on map to see the weather system vertical structure snapshot at certain moment
After we analyze many cases of weather system, we may find there are some similar patterns appearing frequently. We can group these similar patterns into weather classifications.
References:
- 1D Time series: https://forecast.weather.gov/MapClick.php?lat=39.7252&lon=-89.9119&unit=0&lg=english&FcstType=graphical
- Screw-T diagram: https://www.weather.gov/source/zhu/ZHU_Training_Page/convective_parameters/skewt/skewtinfo.html
- Horizontal chart (x-y plot): https://www.weather.gov/forecastmaps
- Hovmoller diagram (x-t plot): https://en.wikipedia.org/wiki/Hovmöller_diagram
- Cross section:
- Vertical Profile (z-t plot): https://www.weather.gov/zse/ZSEModelVWP?site=kbos&height=10&output=barb&table=yes&tailwind=no&runway=00&model=rap&tooltips=on
- Classification of Animals: https://stock.adobe.com/hk/images/classification-of-animals-reptiles-amphibians-mammals-birds-crocodile-fish-bear-tiger-whale-snake-frog-education-diagram-of-biology-engraved-hand-drawn-old-vintage-sketch-chart-of-wild-creatures/205286725
Weather Classification
Same specie animals have little different specialties in different areas, ex: Asian and African elephants, but they both have the big picture characters as an elephant which has heavy weight, a long nose, and large ears. The weather systems have such classifications to group similar situations, such as hurricanes, fronts, and squall-lines etc. Although hurricanes are named differently in different areas, like typhoons, tropical depressions, they have similar characters with heavy wind speed, diameter sizes, and born in tropical area etc.
To classify different patterns, we can use some techniques to distinguish the characters. One of popular technique is principal component analysis (PCA). **Empirical Orthogonal Function (**EOF) analysis is one PCA example which is trying to find unique patterns from a large dataset. We can also use machine learning techniques to cluster patterns. K-mean algorithm is one of popular clustering algorithms which is trying to distinguish dataset into some groups and let samples find their closest group (samples in same group have close characteristics).
The classification technique helps us to learn more about the behavior of a weather system. When we are running a forecasting model, we can verify if the model can simulate the weather system lifecycles reasonably. We can also notify if there is any category we didn’t find in our observation analysis phase.
Since we understand the common classifications, we can run NWP(numerical weather prediction) model to show the prediction to simulate the weather pattern. As long as the model can simulate the weather pattern, it will predict the weather status closely.
References:
- EOF: https://ajdawson.github.io/eofs/latest/userguide/overview.html#eof-analysis-with-eofs
- K-mean algorithm: https://en.wikipedia.org/wiki/K-means_clustering
- Clustering algorithms: https://machinelearningmastery.com/clustering-algorithms-with-python/#:~:text=Cluster analysis%2C or clustering%2C is,or clusters in feature space
